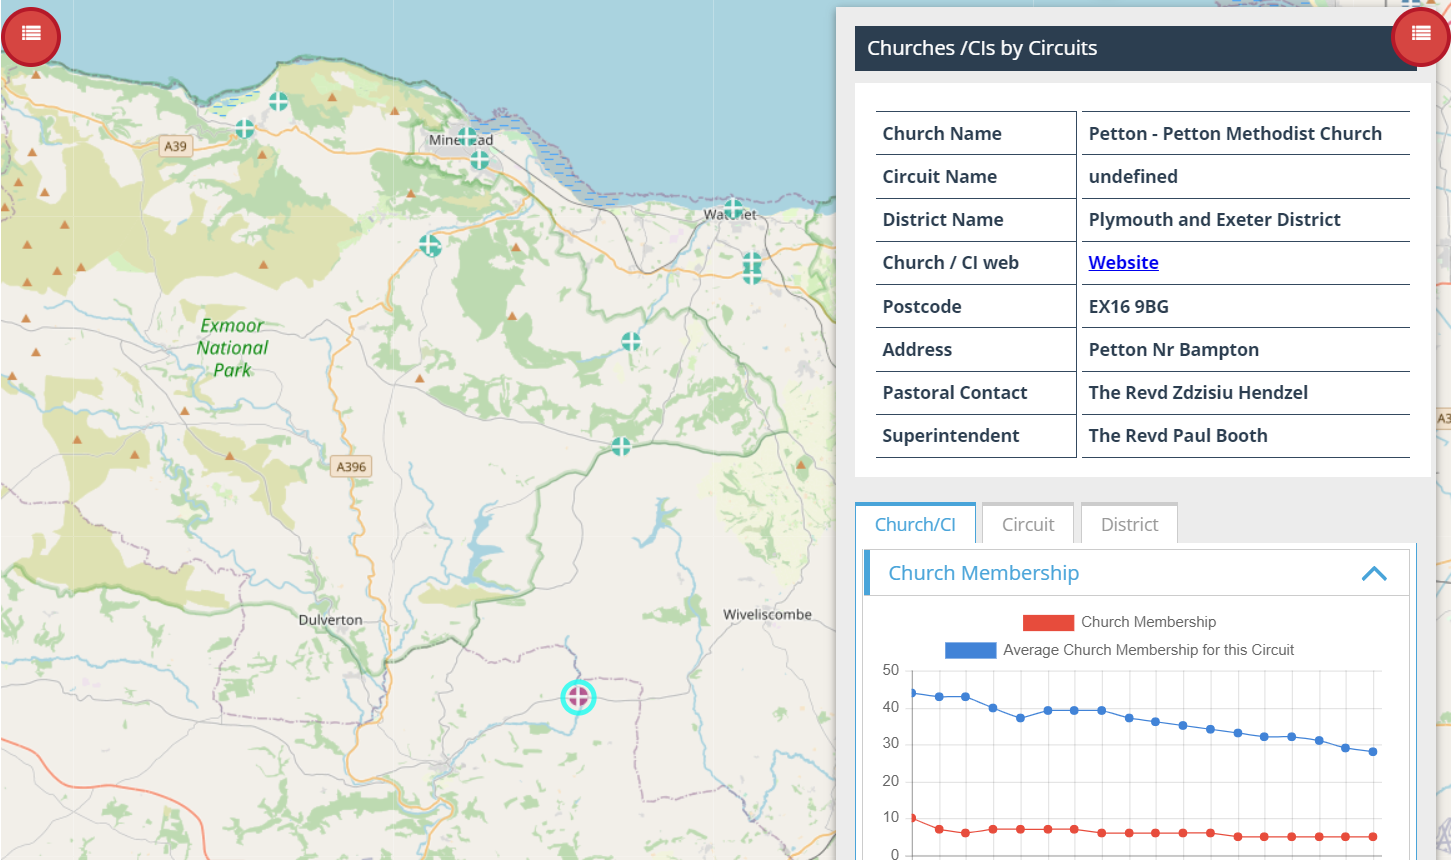

Apart from displaying underlying patterns to explain spatial relationships, another key component to effectively communicating your data and findings is to visualize them in a compelling and intuitive way. No matter if it is through reports, dashboards, static maps or web applications, Groundwork GDS has helped many clients to bring their data to life. We offer customized web solutions, using either ArcGIS web applications or fully fledged JavaScript developments combined with third-party APIs that supports full user interactivity. Customised interactive maps are an effective way for any organisation to visualize spatial information and look for trends and patterns in their operations and/or present data for their users. For example, Groundwork GDS has created interactive maps for clients which allows them to view their site locations alongside the socio-demographic fabric of the surrounding areas. These types of insights can give the organisation a competitive advantage when, for example, planning their human resources or assessing where they are adding value to a community. We have systems in place to customise a web map platform for any organisation and also provide further assistance with the maintenance and updating of the application. Click on the links under relevant projects on the right side to see some examples of our work.
Groundwork GDS is part of Groundwork London